
Main Window
Purpose
Displays the list of all existing Filters, Applications and Transport Entities (TEs).
There is likewise an event logger at the bottom, which can be cleared as required.
The Main Window allows you to:
− Create/Edit/Delete Filter.
The Filter is used to retrieve and display only a specific list of Applications or Transport Entities (TEs)
− Refresh Filter List.
− Create/Edit/View Application.
− Create/Edit/View TEs.
− View a graphical representation of any selected TE (in the TE Graph Tab); this includes a logical graph and / or a physical graph.
− View the Application Mgr. list, which displays all currently on-going Application Edits.
− Display the “Out of Synch” and “Pending Changes” indications.
The “Out of Sync” indication means the NP/BP Databases are desynchronized. The NP User has to run “npresynch”
The “Pending Changes” indication displays the number of pending changes or downloads of changes to the NE(s). The user has to wait until this indication is cleared before he can continue with Application Edit.
Please note:
For background information to Networking Package and sample configuration, please refer to Introduction to Networking Package section.
For detailed information and NP troubleshooting, please refer to “Networking Package User Manual” [1KHW002416].
Dialog image
Networking Package – Applications
Networking Package – Transport Entities
Mandatory entries
Not applicable.
Optional entries
Create Filters,
Set Automatic Routing Parameters,
Multi- Layer Routing.
Informational content
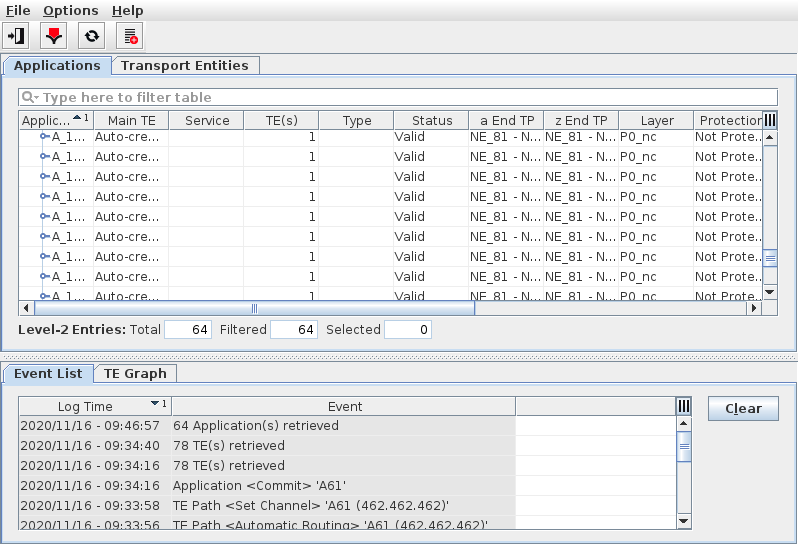
Applications Tab
List all the Filters and Applications:
− Application’s Main TE, number of TEs, Service, Type (Circuit, Trail, SNC), Status, Endpoint Connections, etc.,
− List of Application TEs.
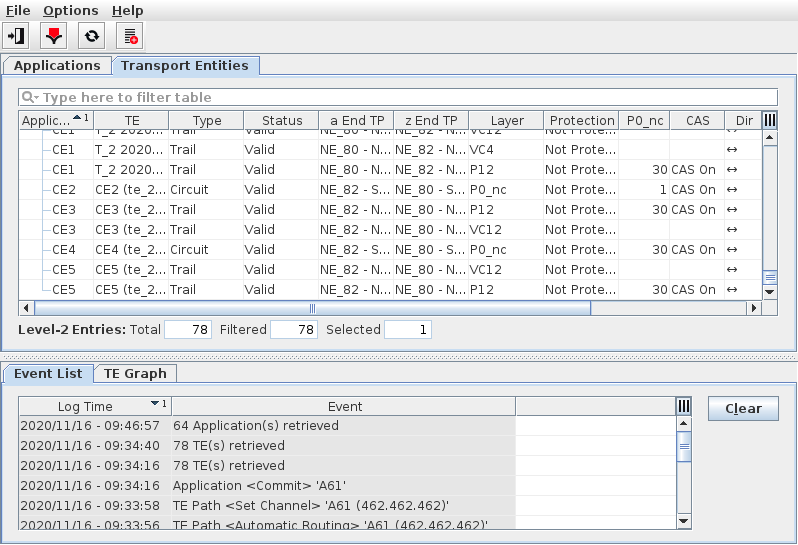
Transport Entities Tab
List all the Filters and Transport Entities without the Applications.
Event List Tab
Shows a list of NP events with their log time and event description.
TE Graph Tab
Shows a graphical presentation of the currently selected entity (TE). The graph includes all known layers relevant for the TE. Different graphical views are presented in the window:
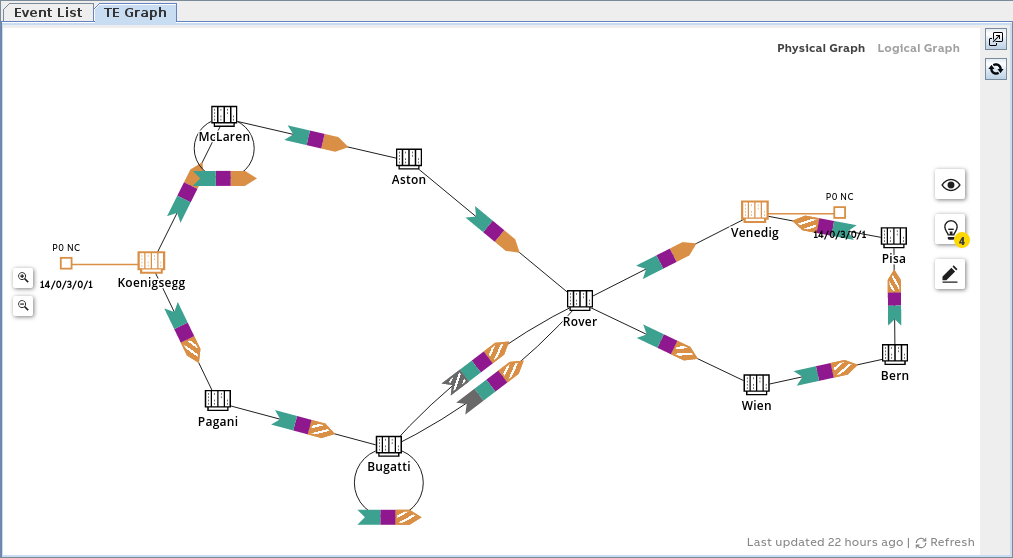
− Physical Graph view: shows the involved NEs, Circuit connections, and sections.
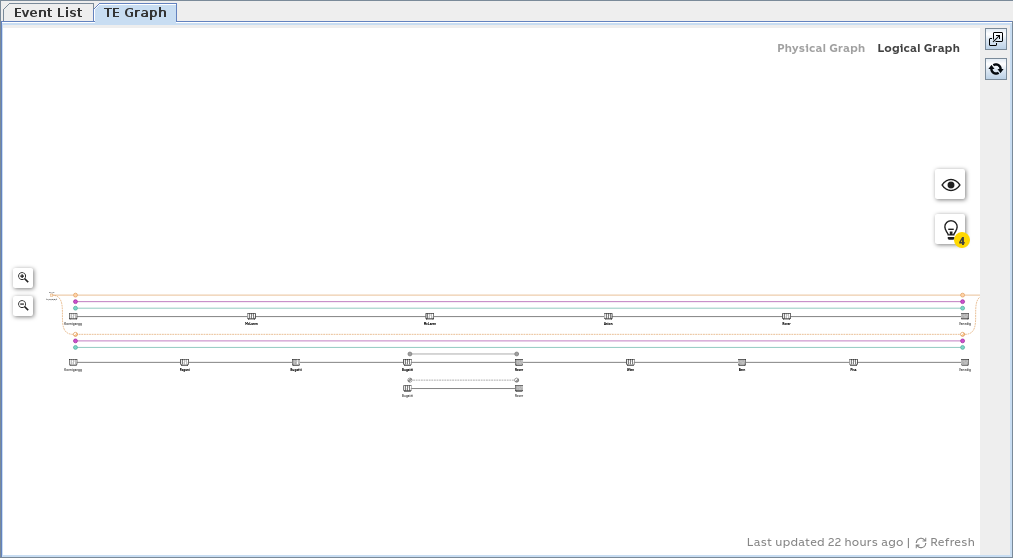
− Logical Graph view: shows the logical layers of the TE, with SNCs, trails, NEs and circuit end points.
− Split view: both Physical Graph and Logical Graph in one window, separated by a split line. The separator between the two graphs can be moved to resize the space for the two graphs by dragging the separator line.
The split view may not be available in the original window due to limited space. You can open the graph in a separate window to get the split view.
The split view may not be available in the original window due to limited space. You can open the graph in a separate window to get the split view.
The graph can be opened in a separate window for better resolution. In this window you can choose from any of the three views.
An auto-resize function optimizes the space for the graph(s). If this is not the best choice for you, you can zoom in or zoom out in either of the graphs.
Below is an example for the physical graph of a P0_nc circuit over a network with 10 nodes:
Below is an example for the logical graph of the same P0_nc circuit as above:
Note that for some TEs a physical graph cannot be displayed, e.g. when there is no physical section associated with the TE. In such cases the physical graph only includes the NE where the logical TE resides. This applies e.g. for SNCs.
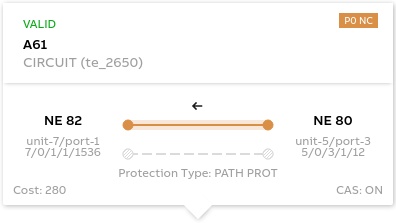
When hovering over a circuit, a section or a trail, additional information is displayed in a pop-up banner. Example for a protected P0_nc circuit:
Controls (buttons, menu items, etc.)
File
Calls the Application Manager List dialog, which displays all currently ongoing Application Edits. | ||
Create |  | Calls the Create Application Filter dialog. |
Refresh Filter List |  | Refreshes the Application Filter List when the BP and NP databases are not in sync. The out of sync indication uses an amber colored icon. |
 | Calls the Application dialog to create a new Application | |
Exit |  | Quits Networking Package |
Event List tab | ||
Clear | Clears the Event list shown in this dialog. | |
Options
Set Auto Routing Parameters | Calls the Set Automatic Routing Parameters dialog to specify parameters used by the Automatic Routing facility of the NP. |
Multi Layer Routing | Select if client rates and higher rates should be included in the Manual Routing: Next Hop List dialog when creating a path/trail. If higher rate is selected, NP will automatically create the missing trails when a higher rate is selected. Note: The higher rate should per default not be suggested. They are confusing and in most cases the higher rates are already provisioned. |
Help
? Help | Calls the help viewer and opens this page. |
Application Filter Context Menu
Retrieve Application |  | Generates a list of NP Applications (data extracted from the NP database) that matches the defined filter attributes. |
Modify Filter… |  | Edits the selected Filter. |
Delete Filter… |  | Deletes the selected Filter. |
Expand | Retrieves and shows all the Applications under the selected Filter. | |
Collapse | Hides the Applications under the selected Filter. |
Application/Transport Entity Context Menu
Details… | Calls the Application dialog to view details of the selected Application. |
Edit | Calls the Application dialog to edit details of the selected Application. |
Show NP Usage… | Opens a dialog to show information on the usage of the selected NP transport entity; see NP Usage. |
Supervision ► Enable… | Enable supervision of this TE. To do that, the service information attributes Customer, Service Level Agreement, and Network need to be selected. |
Supervision ► Disable… | Enable supervision of this TE. Must be confirmed by the user. If service supervision cannot be disabled, an error message is shown with the respective reason(s). |
Supervision ► Resume | Resume service supervision that has been paused before. |
Supervision ► Pause | Pause service supervision. |
Supervision ► Reload Configuration | Reloads the configuration from the NEs to make sure it is up to date in case of recent changes to the TE. |
Supervision ► Show Details… | Show service supervision details for this TE. Opens the TE in a view-only window of the Service Editor. The windows also provides an alarm tab showing active alarms of the TE. |
Supervision ► Show in Service Supervision… | Opens the service supervision dialog with a filtered view for the TE. |
TE Graph
Open in separate window | Open the TE Graph in a separate window for maximum space. | |
Reload | Reloads and rebuilds the graph |
TE Graph, context sensitive
Options | Legend: Shows a legend of the graphical symbols and colors used in the graph. View Options: choose from the following options: - PATHS: - Working Path; - Protecting Path; - Sub Protecting Path. - VIEW SETTINGS: enable or disable the following options: - Show fixed TEs; - Show SNCs as Cloud; - Show Indistinct Sections. - LABELS: - Show TE labels; - Show NE IDs; - Show Shared Resource Counts; For protected TEs, indicates with a digit the number of TEs routed over shared resources. | |
Issues | Shows possible issues that apply to the selected TE such as - Shared resources that represent a potential single point of failure, - resources that have a status issue, - Holes present in a TE due to incomplete routing. | |
Edit | Toggle between Edit and View mode. In Edit mode you can edit the layout of the elements in the graph. You can move NEs to get a customized arrangement of NEs and sections. This is applicable to the physical graph only. | |
Refresh | Refreshes the graph. | |
Separator | In the split view, move the graph separator upwards or downwards: - upwards: give more space to the logical graph; - downwards: give more space to the physical graph. | |
Zoom in | Zoom in to the graph. Applicable separately to each graph. | |
Zoom out | Zoom out of the graph. Applicable separately to each graph. | |
Fit | Fit the graph sub-window with the following options: - Fit to screen, - Fit to height, - Fit to width. | |
Download | Save a graphics file to your machine. The file is stored in the default download folder. Applicable separately to each graph. You can choose among two formats: - PNG, - SVC. |
TE Graph, selected Circuit or Trail
Details | Opens the Application dialog for the selected element to show details on the selected application and TE. | |
Show NP Usage | Opens the NP Usage dialog for the selected element. |
TE Graph, selected NE
Configuration | Opens the Local Craft Terminal for the selected NE, using the chosen user class. | |
Alarm List | Opens the list of active alarms for the selected NE. |
Table Sorting and Filtering/Export and Printing
Please refer to Table Sorter section for details.
Related dialogs / windows