
TE Graph
For any Transport Entity (TE), the network graph can be shown as logical and/or physical diagram within the same window. When selecting a TE, the graph is calculated based on the TE characteristics, and displayed in a built-in, zoomable browser window. Beside several view options, a list of possible issues can be displayed. The graphs can be saved to a png or svc file.
The logical graph shows all logical layers of the selected TE. Working and/or protecting paths, fixed TEs, TE labels, NE IDs, shared resource counts, and other view options can be set via an options menu.
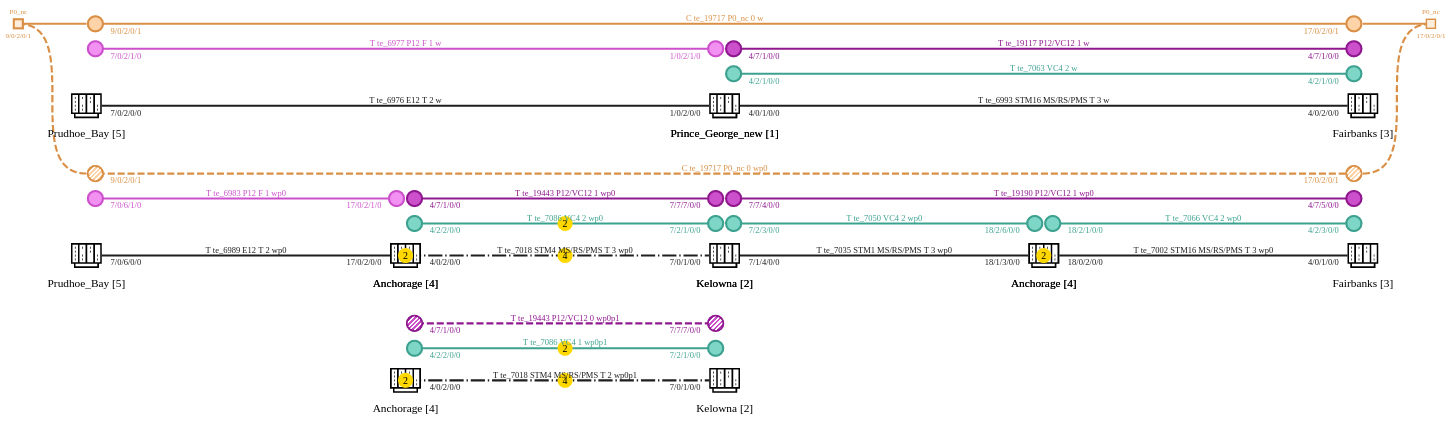
TE Graph - logical, Example
From the TE Graph window, the following context sensitive options are available:
• Open an NE’s configuration with selectable user class;
• Open the list of active alarms for a selected NE;
• Open the NP Usage dialog for a selected section, trail, or circuit;
• Open the Application dialog for a selected element to show details on the application and the TE.
The physical graph shows the physical arrangement of NEs, sections (including working and protection), and circuit access points. Among others, working and/or protecting paths, and fixed TEs can be selected as view options. The NEs in the physical graph can be rearranged when in the edit mode.
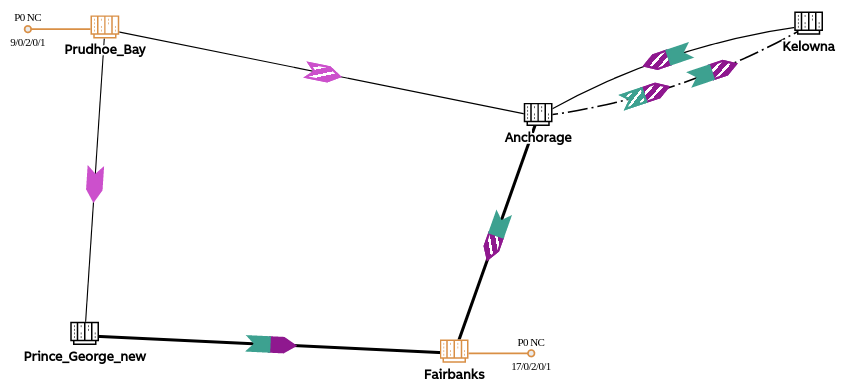
TE Graph - physical, Example