
Network Monitoring
The Network Monitoring application provides a map or table view with all relevant information on the following tabs:
• Overview,
• Section,
• NE,
related to the network health and performance. For detailed information on the Network Monitoring application, refer to the user manual “Network Monitoring - Health Monitoring Feature” [1MRC000115].
Overview
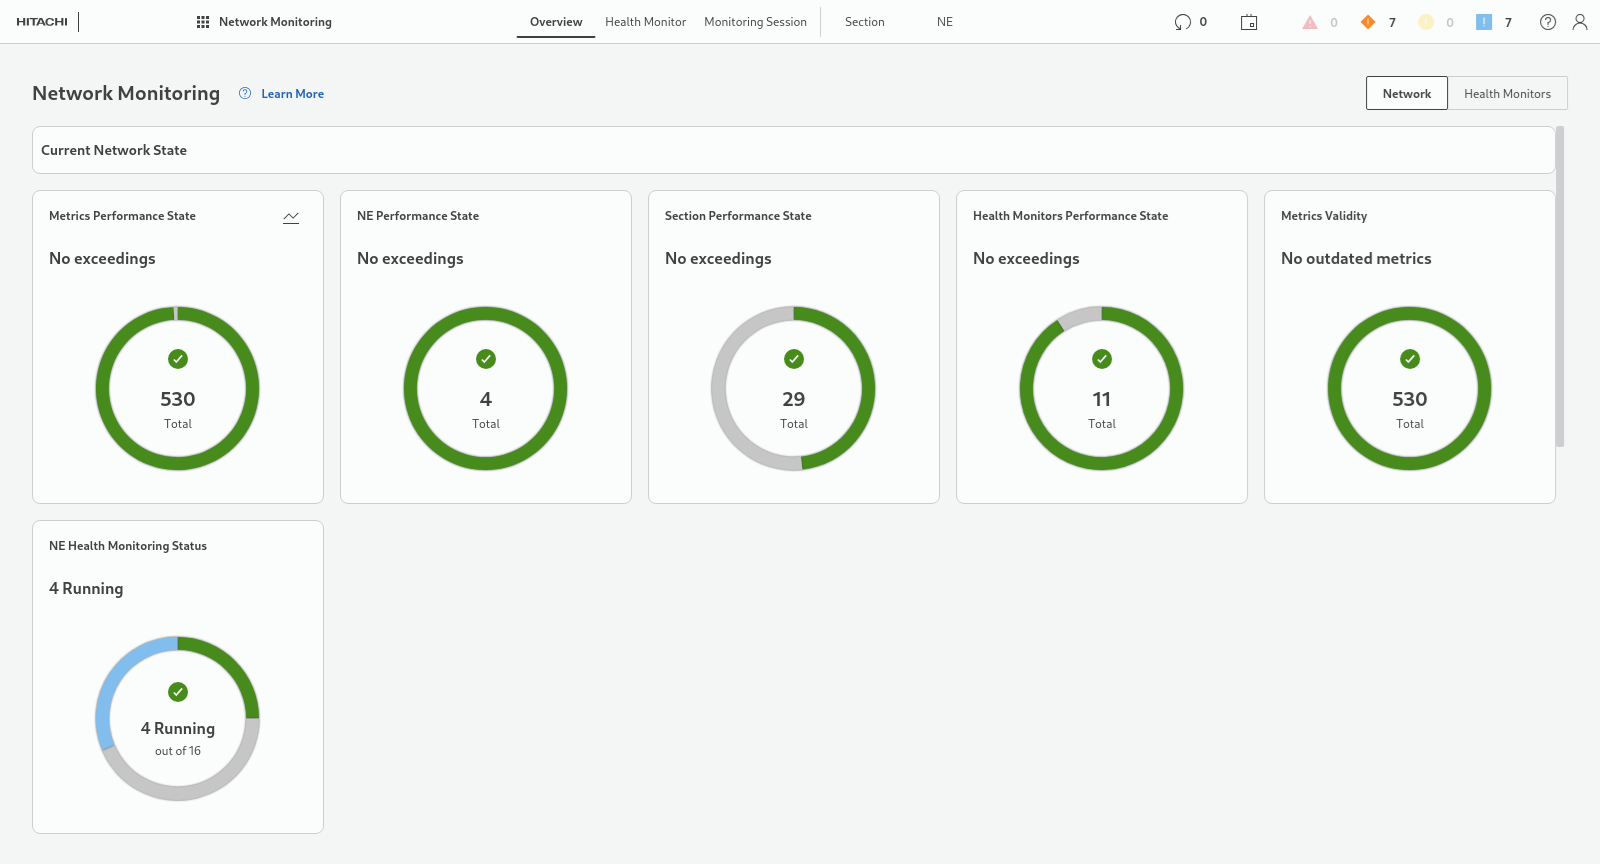
The overview tab is the dashboard for a quick overview of the network performance status and history. Overviews and diagrams, where appropriate, are shown for the selected time. The overview provides the following graphical views:
• Network,
An overview page with widgets providing graphical overviews on various aspects of network performance, network elements performance, and sections performance.
• Health Monitors, including the tabs
− Performance State,
displaying collected performance data for all Health Monitors,
− Values,
displaying charts for the selected time span (via Global Time Selector) for all Health Monitors,
• Metrics Collections,
providing a chart of the NEs health monitoring status.
Flexible options allow selection of history intervals via the “Global Time selector for all charts”, such as
• Last 24 Hours,
• Last 7 Days,
• Last 30 Days.
Health Monitor
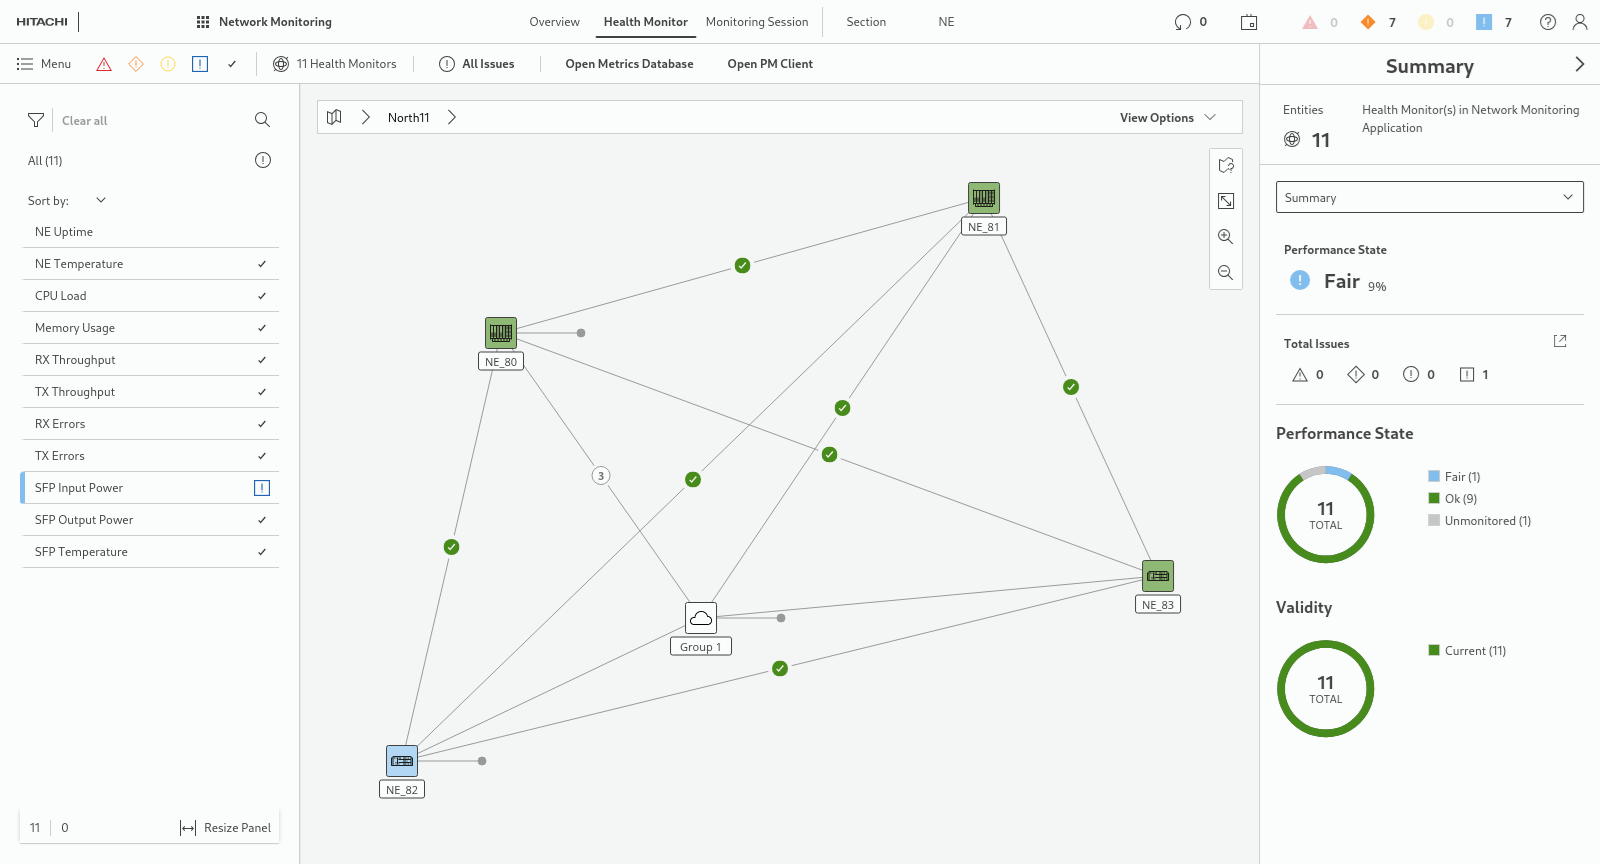
Under the Health Monitor tab, the monitoring session collects health data from all elements of the network that provide appropriate data and presents the data on the network map and in a table in the entity browser (left panel). In the Summary (right panel) an overview on all monitored elements in the network is presented. It includes various monitored parameters, such as
• TX Errors,
• RX Errors,
• NE Uptime,
• NE Temperature,
• CPU Load,
• SFP Temperature,
• SFP Output Power,
• SFP Input Power,
• RX Throughput,
• TX Throughput,
• Memory Usage.
Upon selecting a specific monitor in the entity browser (left panel), the related health status is shown in the right panel.
Metrics
Details
When opening ‘Metrics’ from the ribbon or the context menu for a selected Health Monitor, a table with all the metrics of the given monitor is displayed in the “Details” view.
The predefined state filters
• Bad State,
• Poor State,
• Fair State,
• Ok State,
• Unmonitored State,
can be set or reset by clicking any of them.
The selectable option “Show Line Chart” activates a line chart view of a single or multiple selected metrics. The number of concurrent metrics shown in the line chart is limited.
An example for the NE temperature line chart details of four NEs is given below:
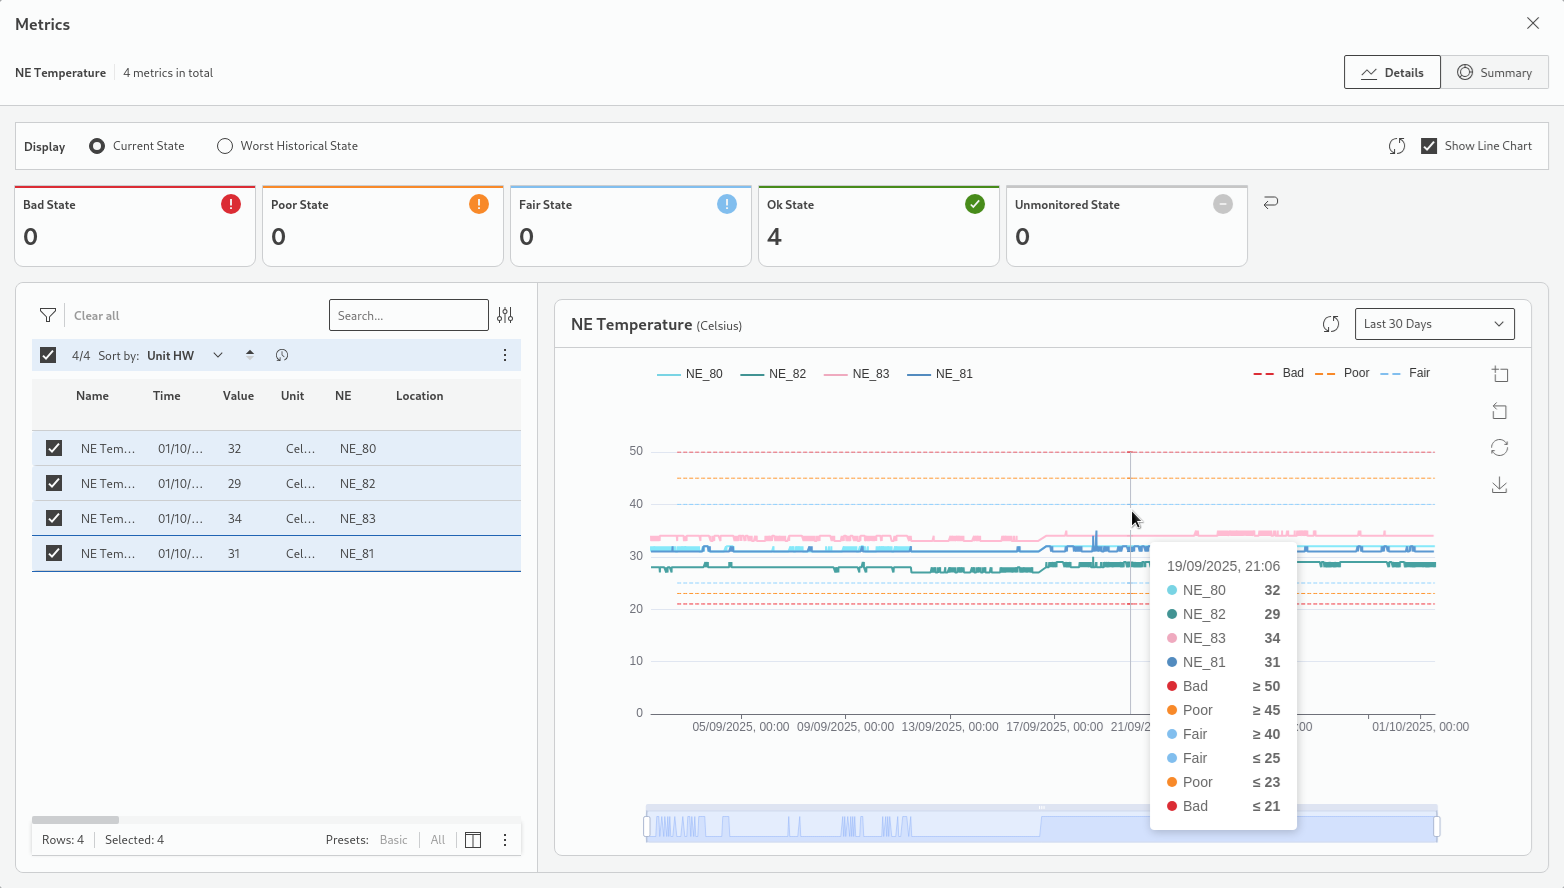
The drop-down list in the line chart title bar provides selectable default time periods. Two rulers (start date&time, end date&time) below the line chart allow you to further adjust the time span shown in the chart. You can also
• zoom into the chart by clicking on the “Zoom” icon and using the pointer device to select a span within the chart;
• go back to the previous zoom;
• reset the zoom;
• save the chart as an image file (png format);
• update the chart with the latest metrics.
When placing the pointer into the chart, details on the captured metrics samples are shown in a tooltip window.
Summary
The “Summary” view shows a summary of the selected metrics type with donut charts and a state history diagram with individually selectable filters for Bad, Poor, Fair, OK, and Unmonitored performance states.
Monitoring Session
Information on the related monitoring session, including a detailed view, is presented under the Monitoring Session tab. In the details view, among others, General information, and Threshold Configuration with defaults and overrides are available.
The Threshold Configuration page lets you
• under Defaults,
− view default thresholds for defined metrics,
− edit default thresholds by selecting an existing entry and clicking on “Edit”;
• under Overrides,
− add a new threshold override for specific metrics,
− edit an existing threshold override,
− remove an existing threshold override.
Section
Health information on sections is presented under the Section tab with a summary or individual details for a selected section, including specific metrics, such as SFP related metrics of the two section end points where available.
NE
Health information on NEs is presented under the NE tab with a summary or individual details for a selected NE, including specific metrics, such as SFP related metrics of SFP-based ports on the NE where available.