Opening the Metrics Database
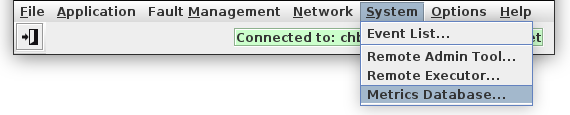
Start the Metrics Database UI from NEM Desktop by navigating to ‘System -> Metrics Database...’.
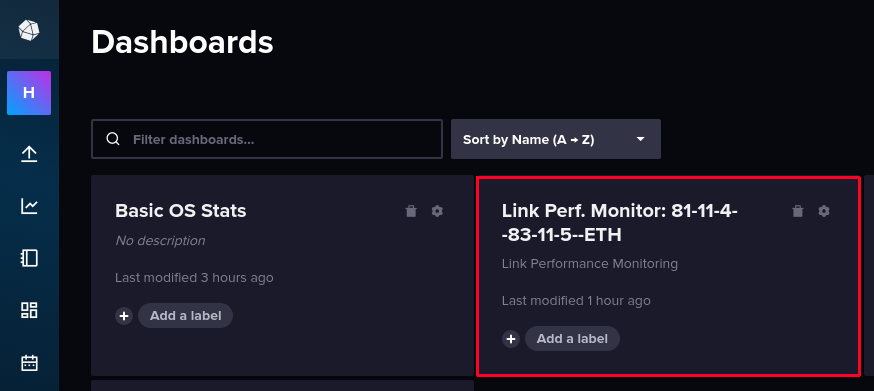
Once inside InfluxDB GUI, click the “Dashboards” icon in the middle of the left-hand side icon bar…
to navigate to the Dashboards and click on the newly created Dashboard (as per description in section Launching) to view the PM counter information and collected PM data.
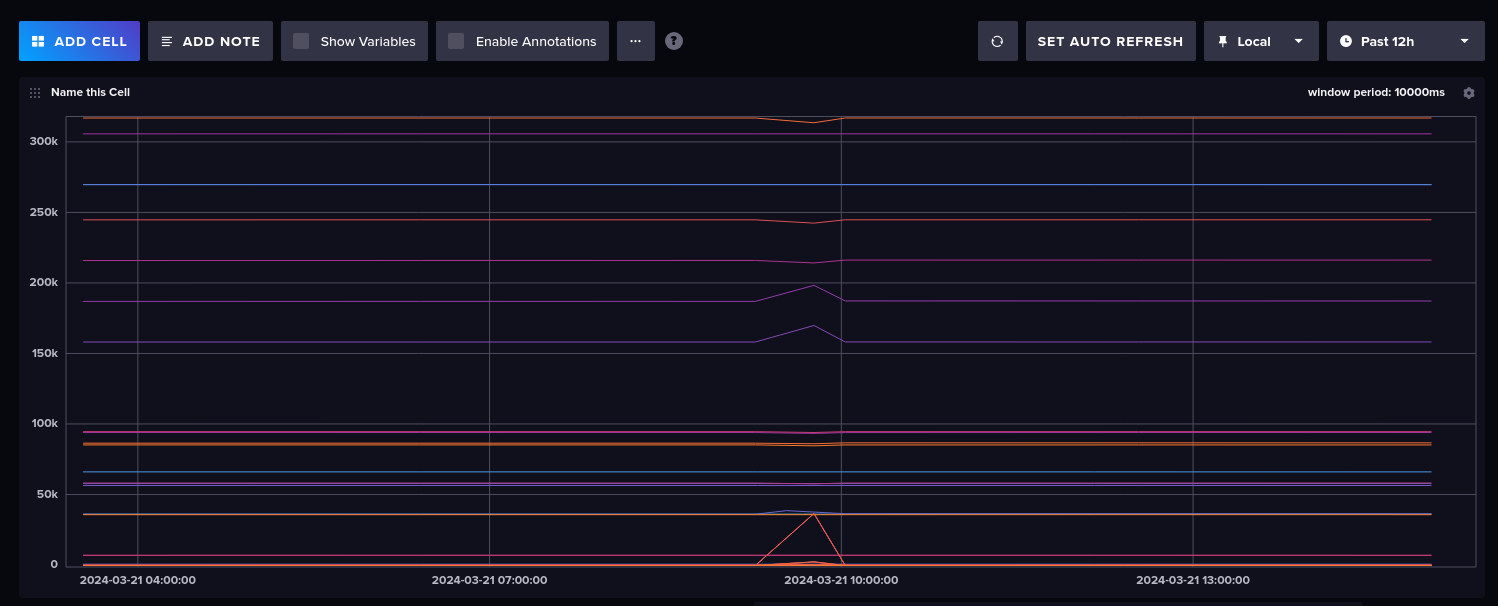
The graph names are self-explanatory. User may choose between 15m and 24h counters by picking either ‘statistic_15m’ or ‘statistic_24h’, depending on the PM data intervals activated n the PM collection job. The time period may be adjusted in the upper right corner.
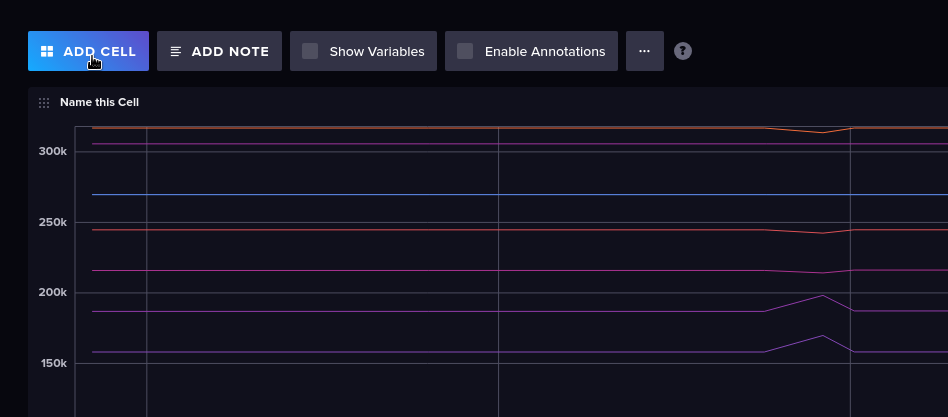
To modify an existing dashboard, click on the “Add Cell” button in the upper left corner of the dashboard:
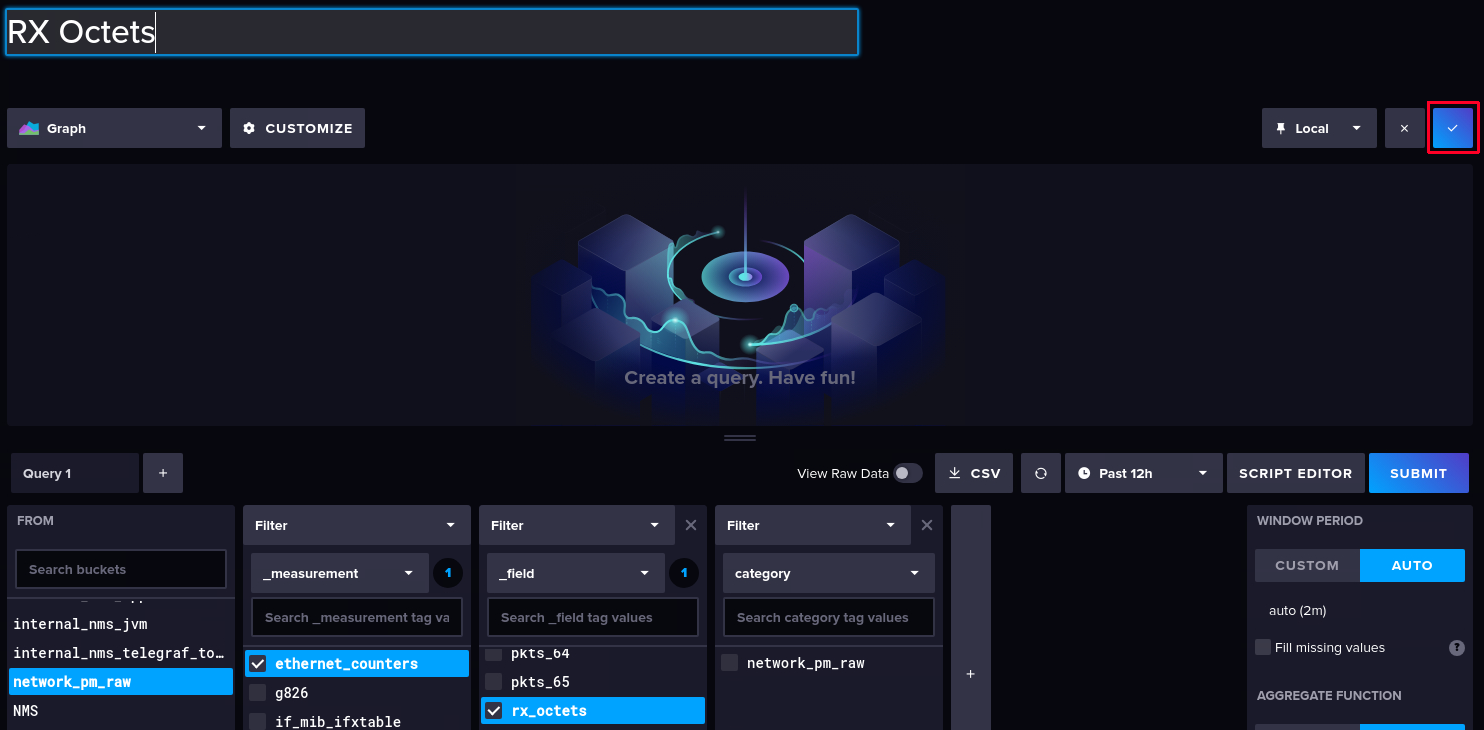
Give the new cell a name, select
• source (“FROM”), e.g. “network_pm_raw”,
• Filter / _measurement, e.g. “ethernet_counters”,
• Filter / _field, e.g. “rx_octets”,
• Filter / category, e.g. “network_pm_raw”,
and apply the change by clicking on the apply button:
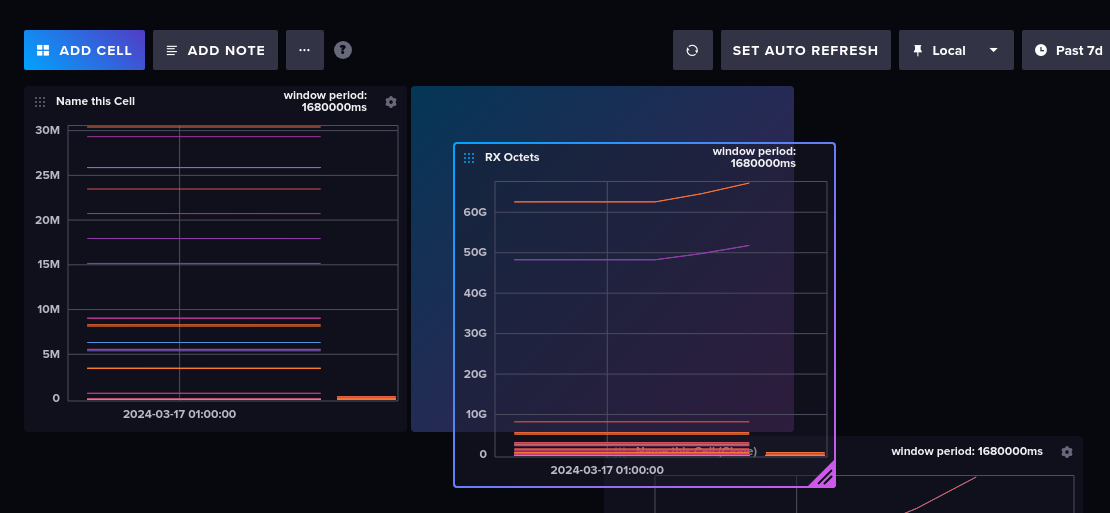
This will add the new cell (diagram) to the existing dashboard. You can rearrange, resize, move or delete cells (diagrams) on the dashboard by drag the lower right corner to resize:
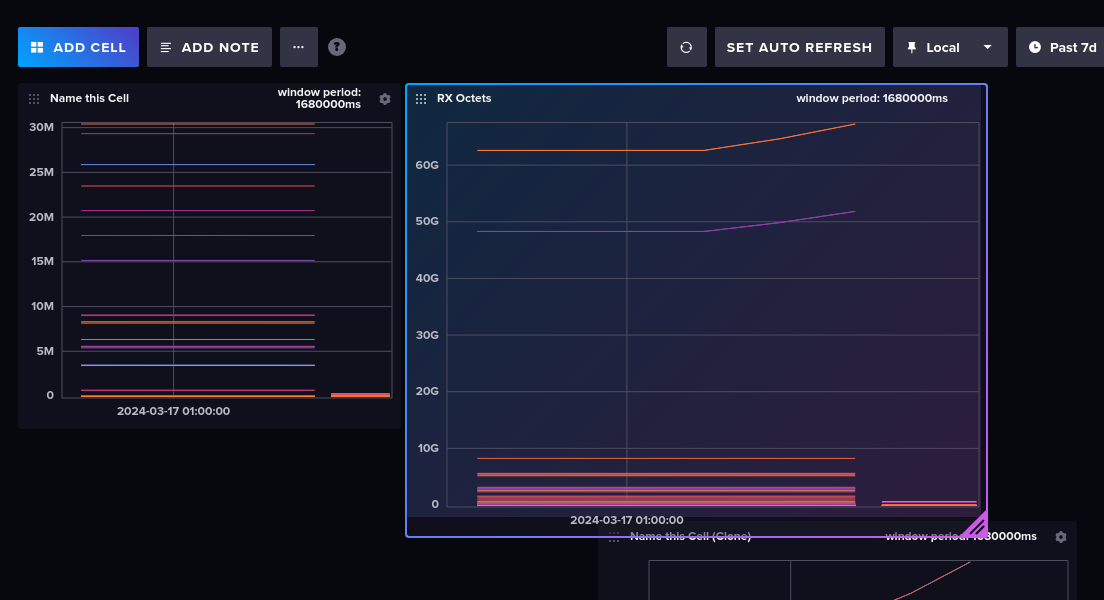
or click and hold the upper left 9-dot icon to move a cell: