
Visualizing multiple services and Transport Entities
Multiple services or transport entities can be visualized at the same time. When selecting up to 8 entities – every entity will be visualized with different color. When multiple selected connections or LSPs are going through the same path counter is presented.
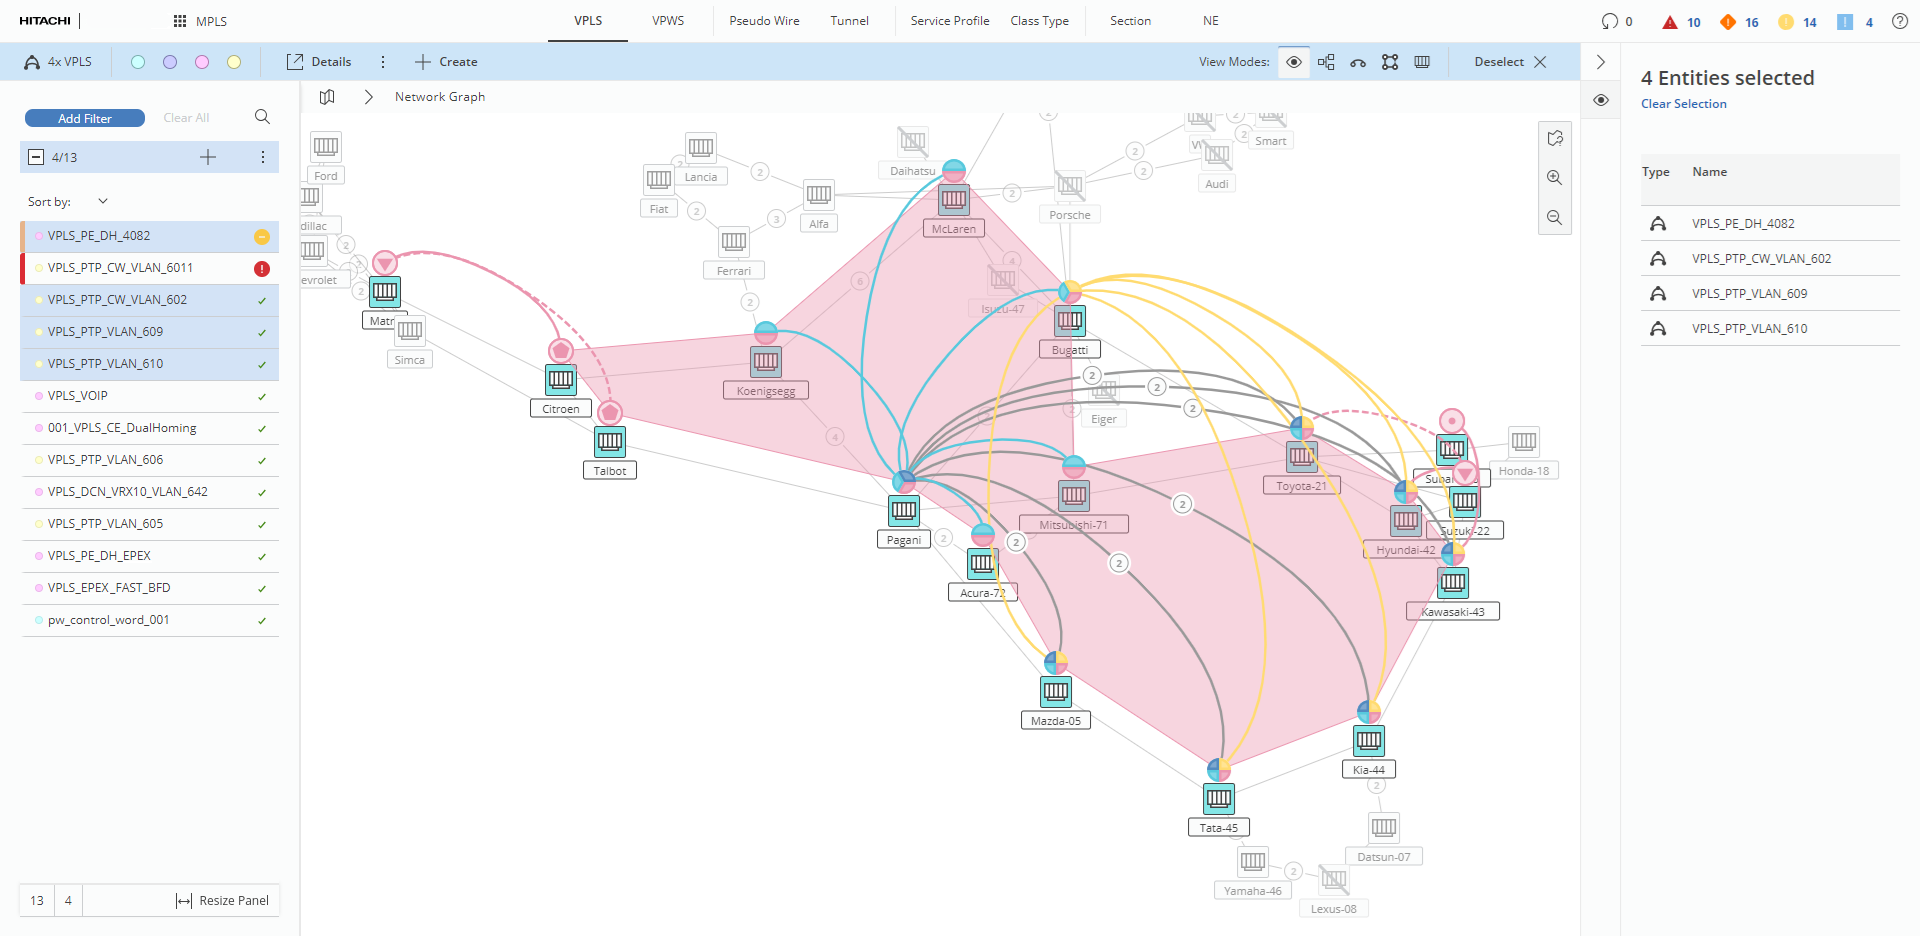
Selected multiple services
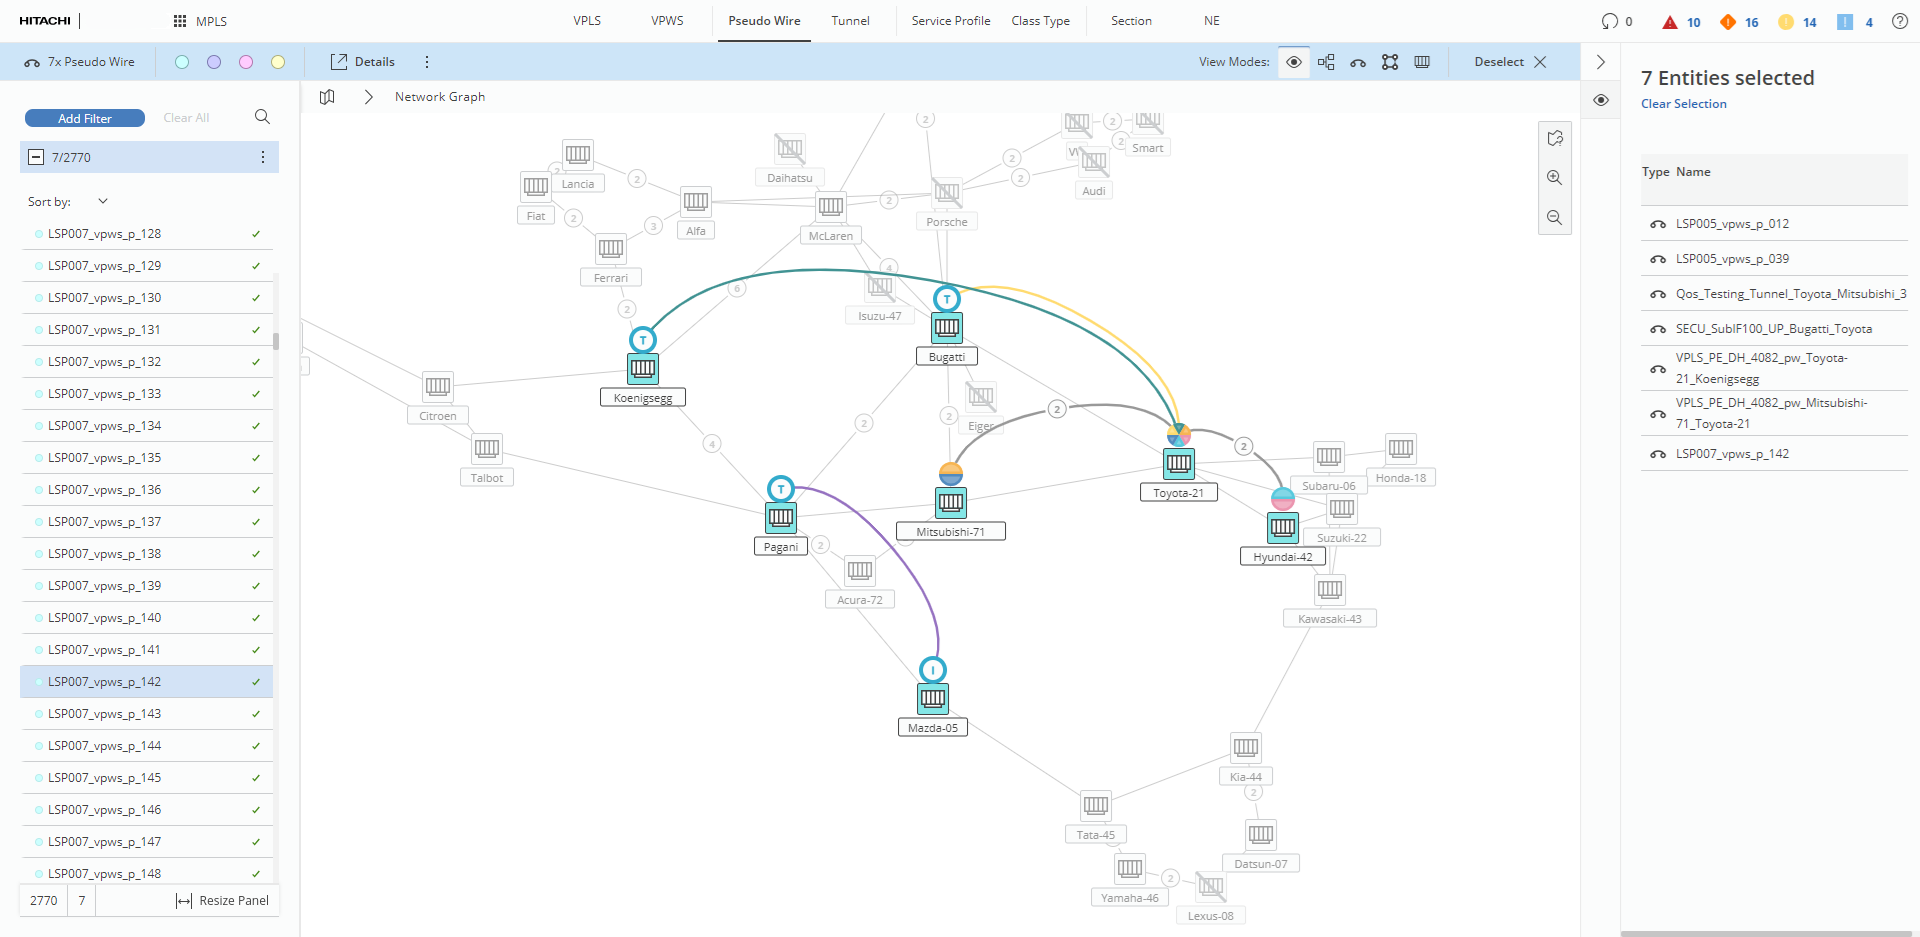
Selected multiple pseudowires
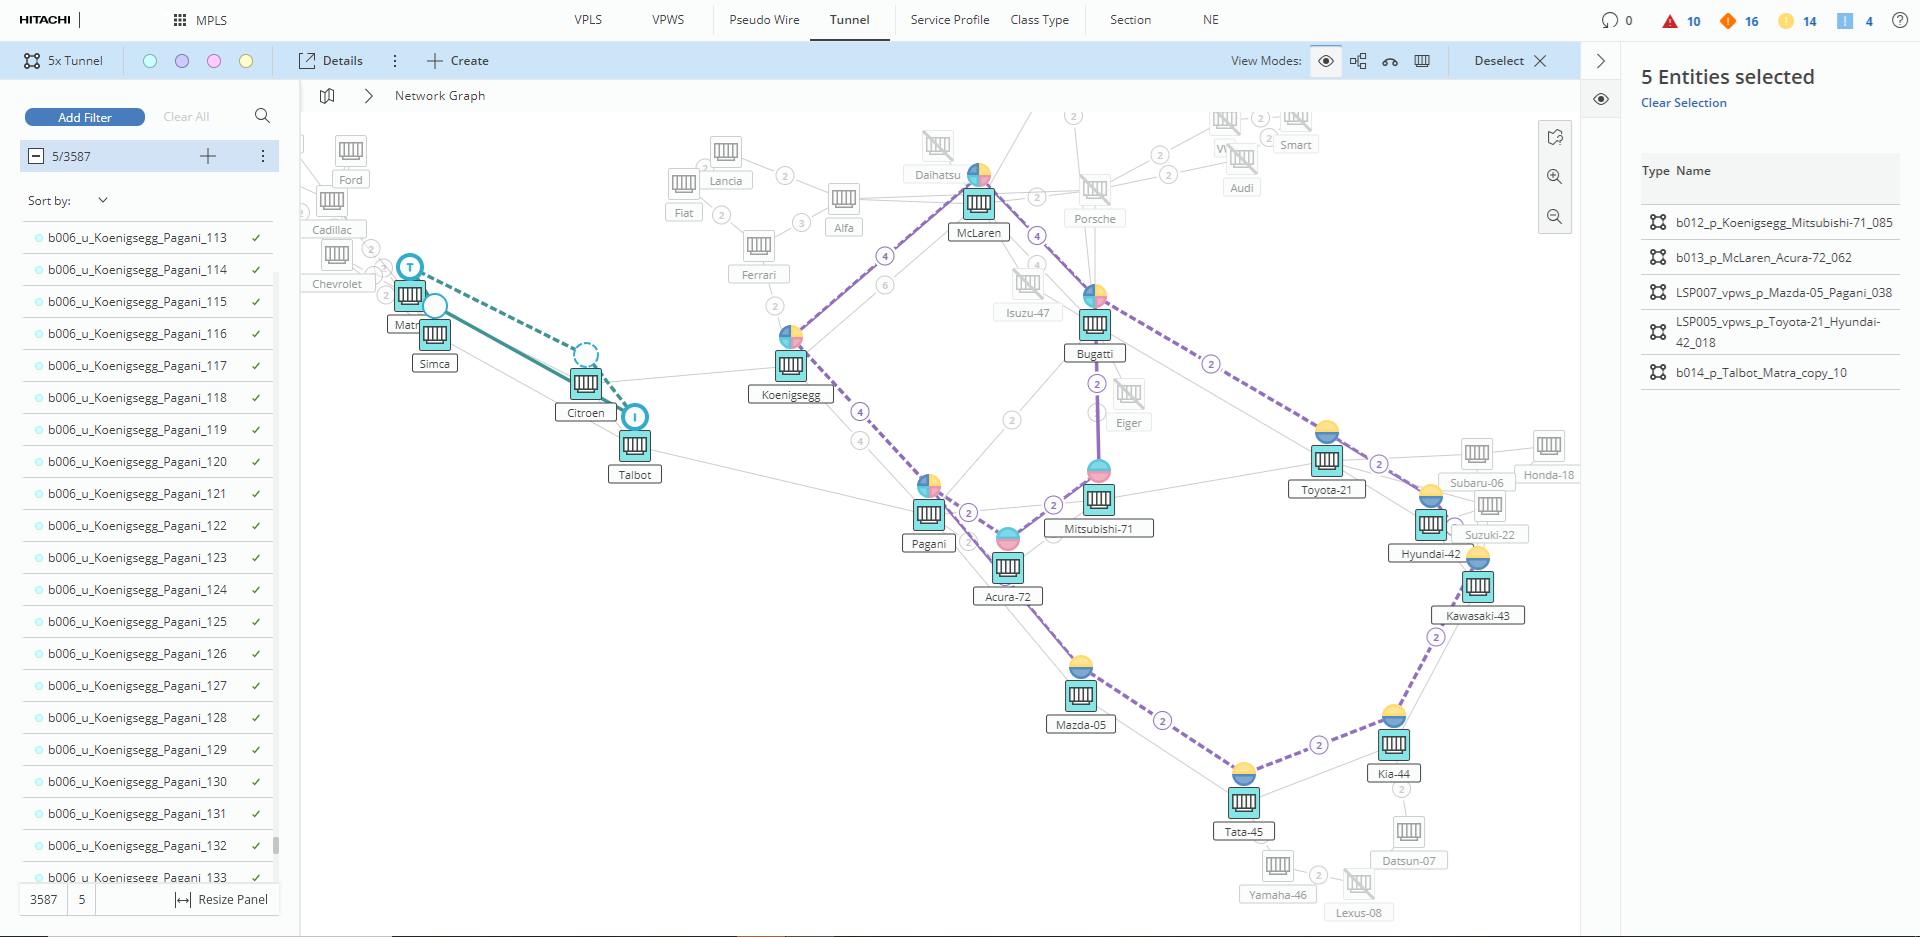
Selected multiple tunnels