
Visualizing Service and Transport Entities
Selecting services or transport entities add visualization layer on default view. They also impact visualization of the network elements – presenting their role in selected services.
VPLS are visualized presenting the connections between entities. They can be represented in form of arches or areas. Colored areas between network elements indicate full mesh connections. Arches can be visualized with dashed or full lines. Dashed lines indicate secondary connections.
Tunnels are visualized using dashed or full lines. Dashed lines indicate protecting LSPs, full lines indicate working LSPs.
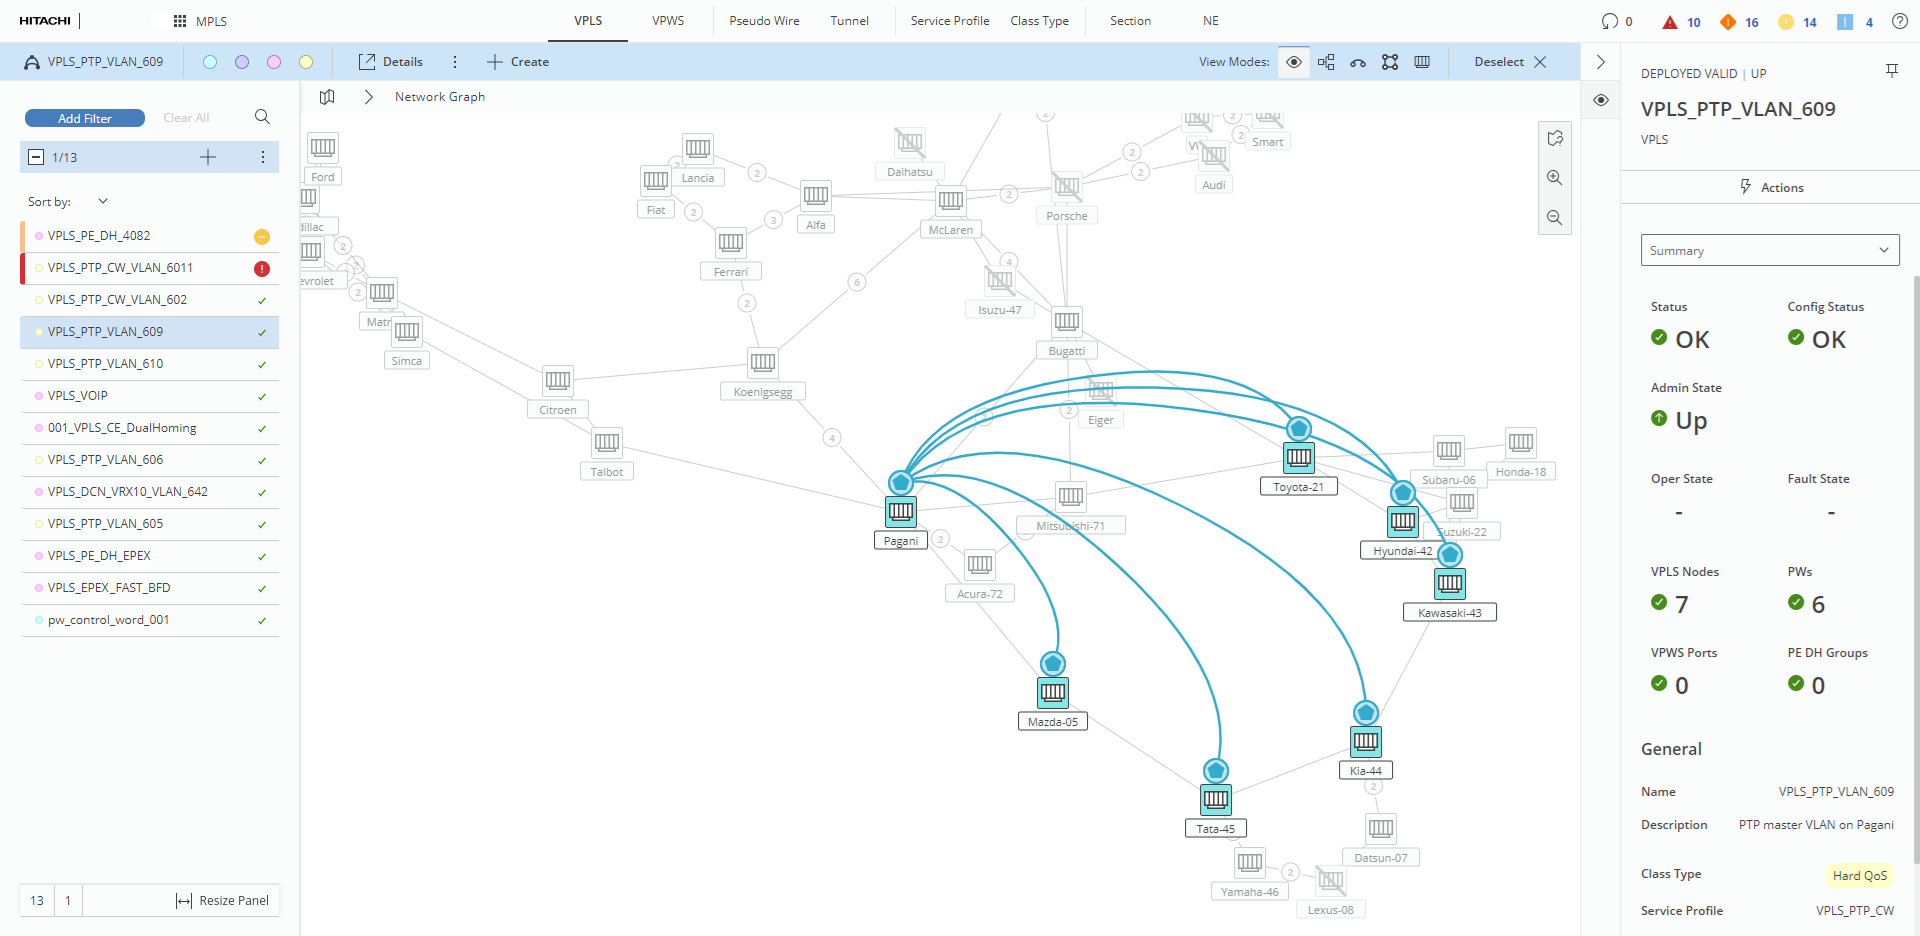
Visualization of VPLS without full mesh connections
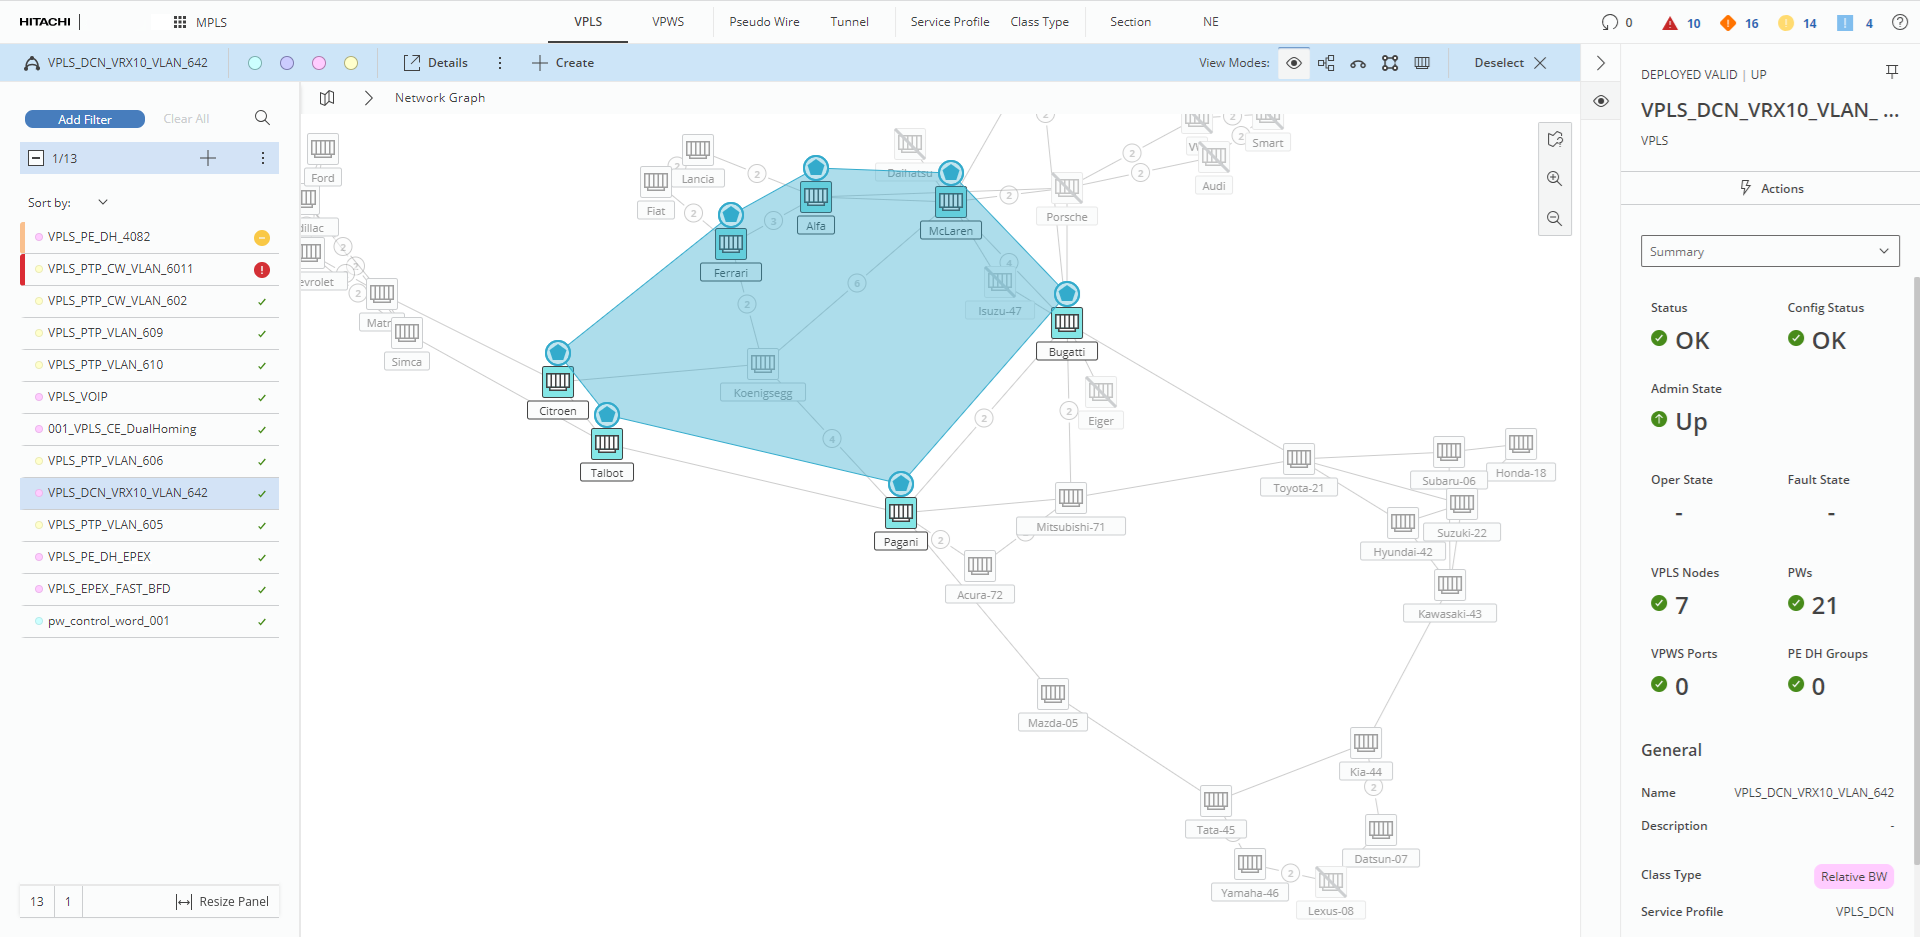
Visualization of VPLS with only full mesh connections
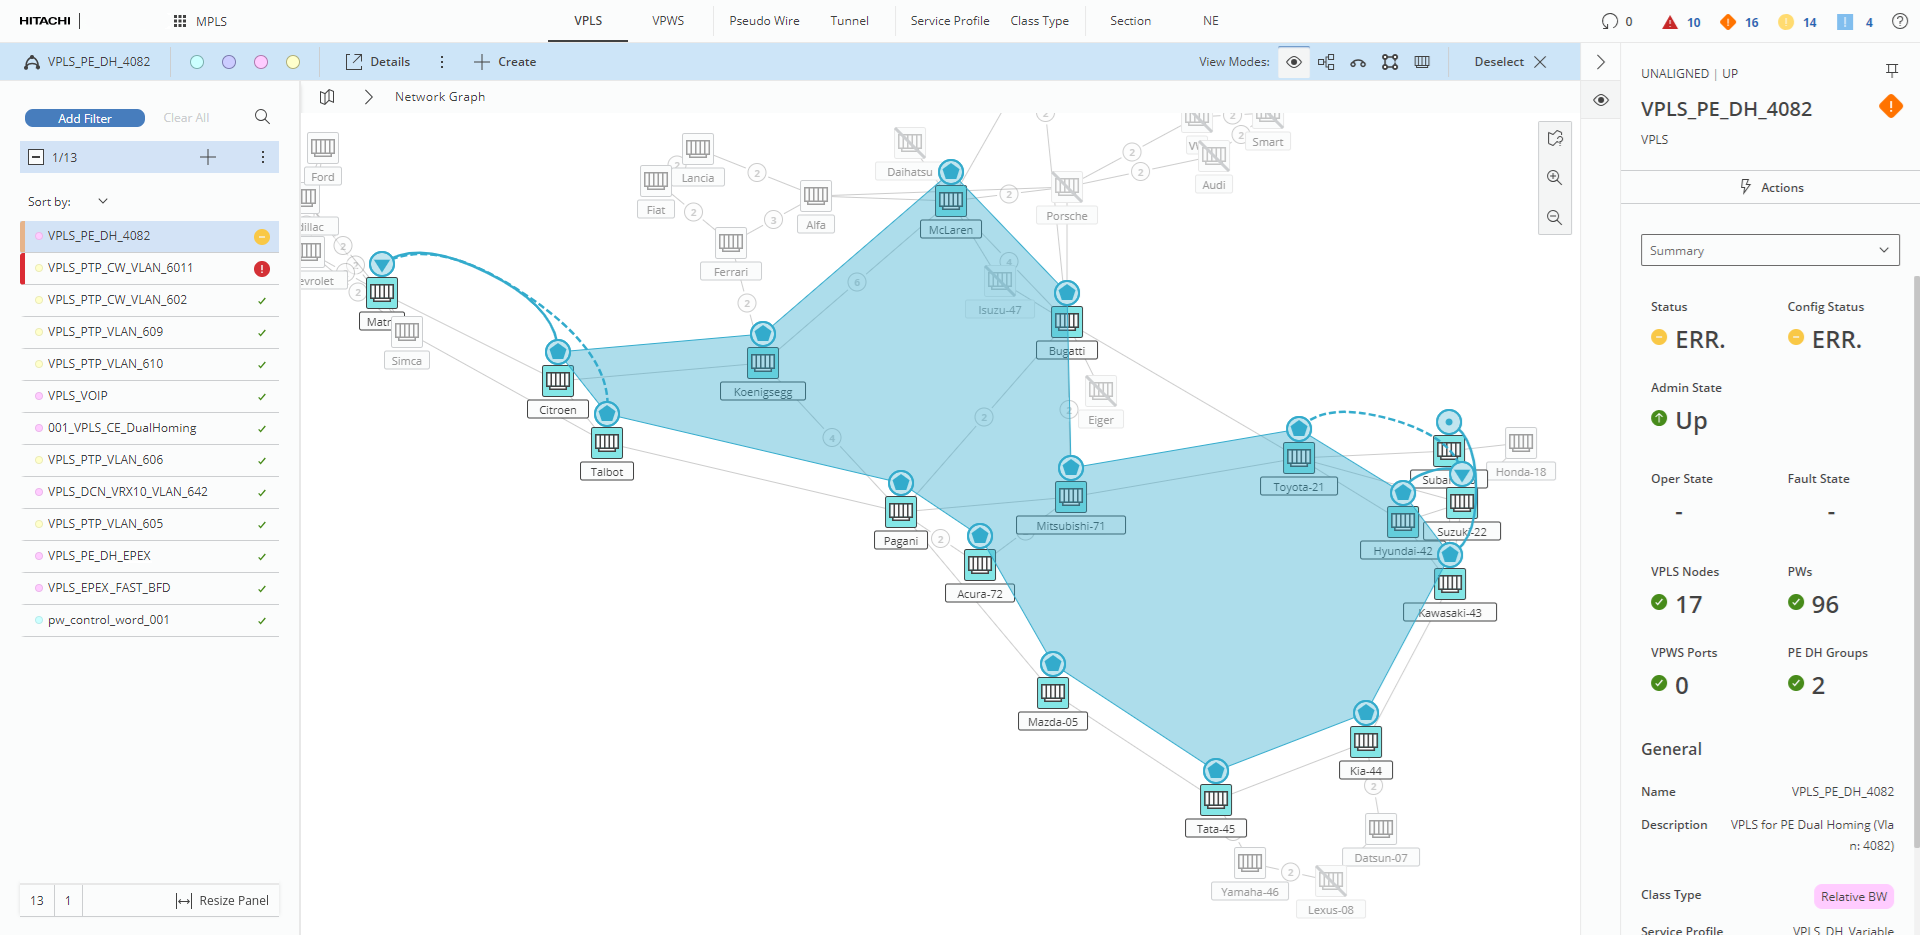
Visualization of VPLS with various types of connections
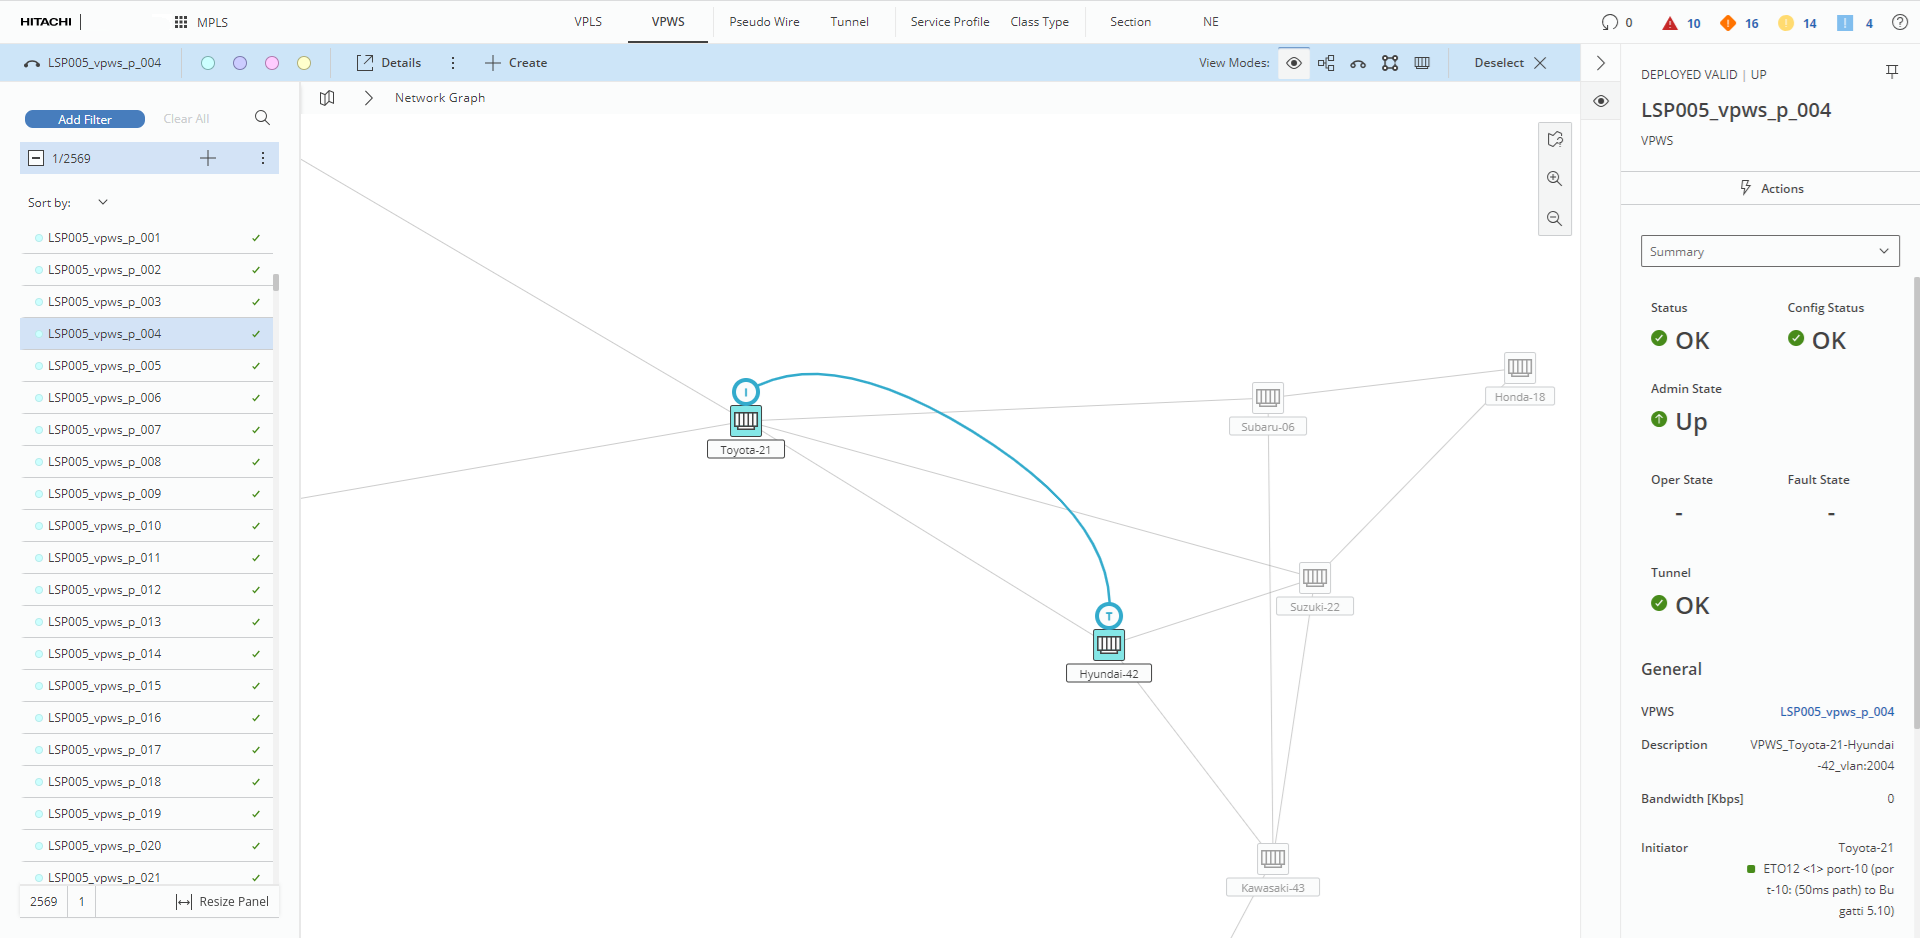
Visualization of single VPWS
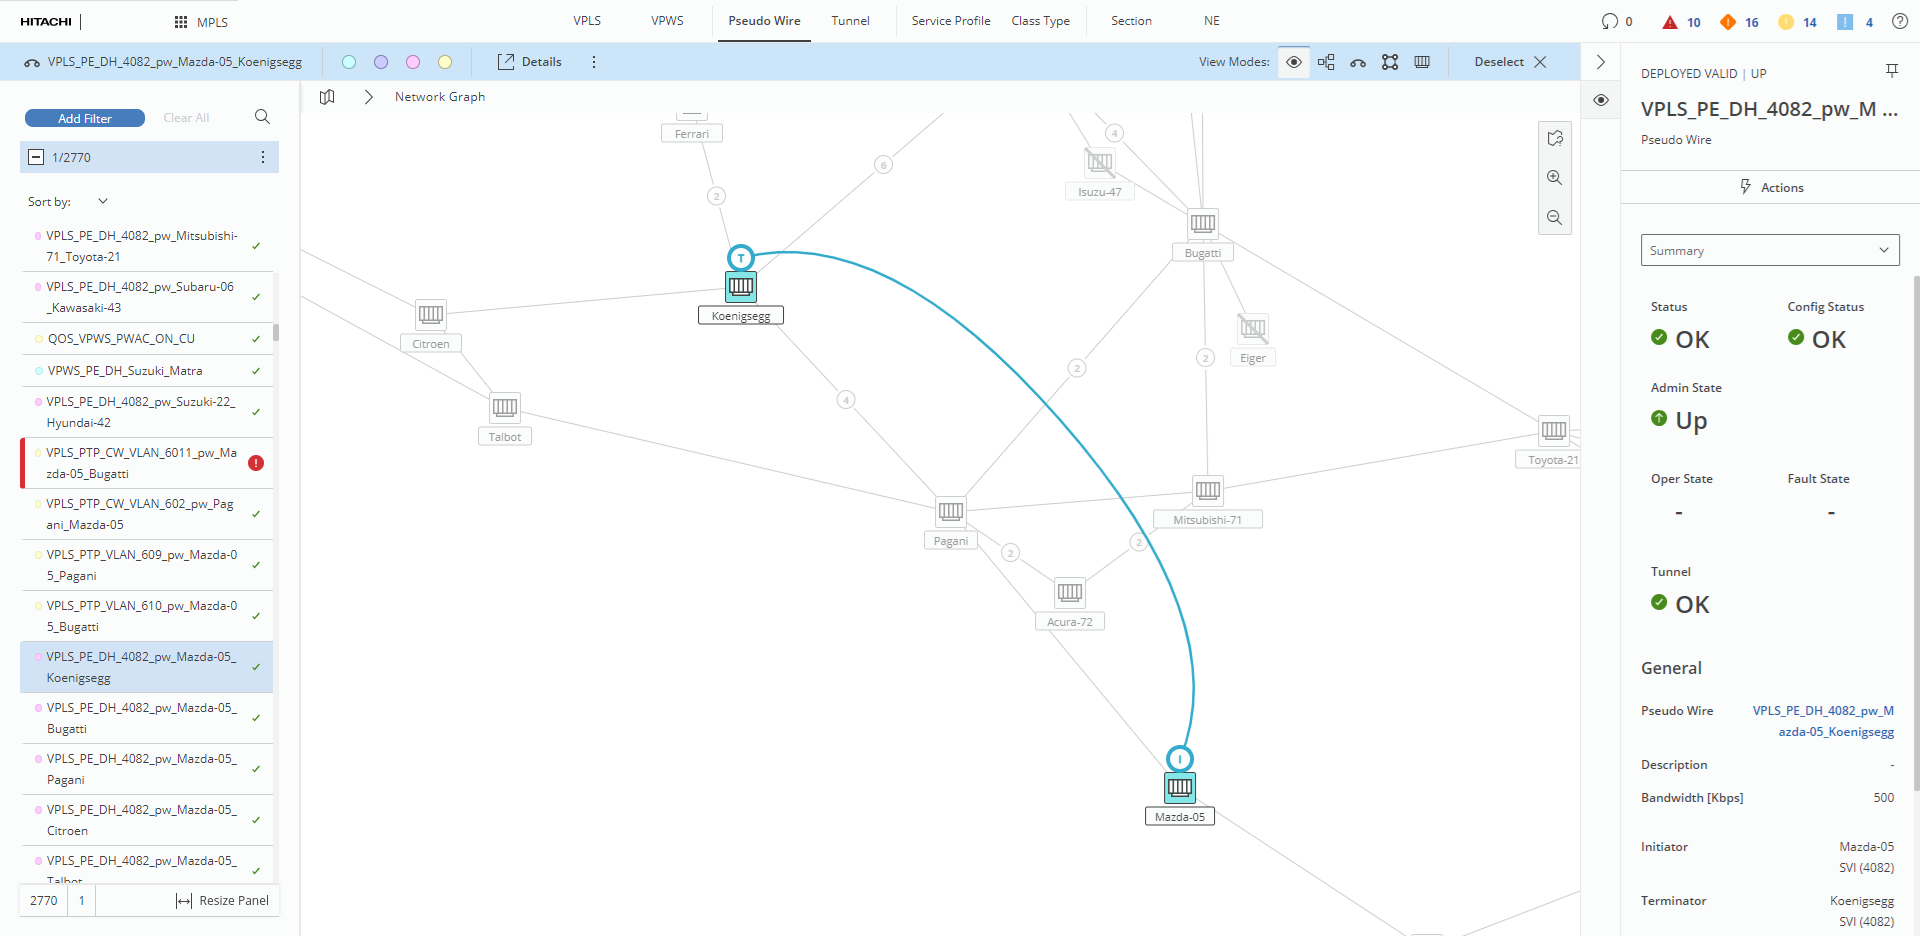
Visualization of single pseudowire
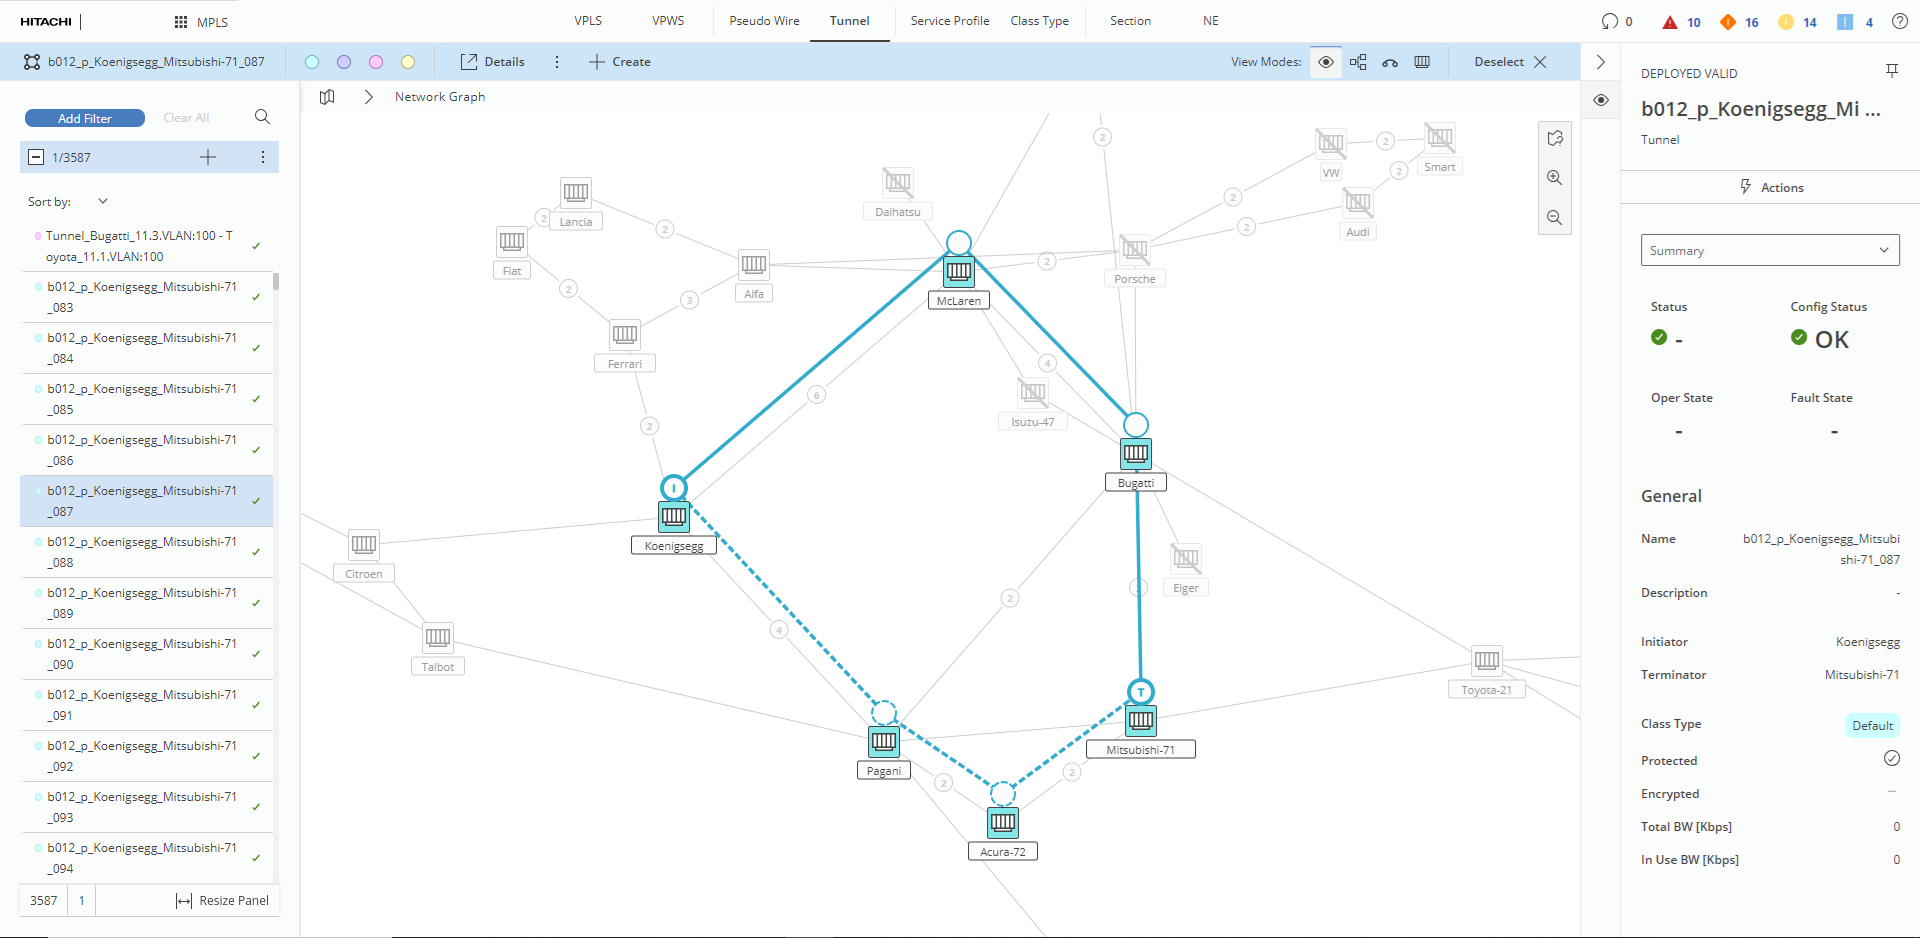
Visualization of single tunnel