
Additional views, modes, and concepts
Tasks, System Events, and Alarms Visualization Modes
Within the map applications there are additional modes that enable the user to visualize additional layer of information in the network context. These modes are:
• Task Mode,
• Log Event Mode (System Events),
• Alarms Mode.
These modes are available contextually in the map applications. The modes enable the user to see lists of tasks, system events or alarms displayed in the entity browser (Left Panel), and if possible, visualize them on the network’s map.
The modes can be enabled from the common header by clicking the alarm or the task summary. They act as overlays on the default view and can be toggled on or off on demand. Activation of these modes is represented by blue highlight of the alarm or the task summary component in the common header and special appearance of the ribbon (additional color line at the top of the ribbon + additional alarms or tasks badge). The interactions in these modes are similar to the interactions in the default view – selection in the entity browser (Left Panel) changes state of the ribbon to “selected”, visualize (if possible) alarm or task on map, open alarm or task details in the details panel.
Alarms or tasks can be pinned in the details navigation bar in similar manner as any other entity.
To turn off the modes, the user can click “close mode” button in the ribbon or click highlighted alarm or task summary component in common header.
When the alarm or task visualization mode is enabled, the user cannot select a tab from the navigation in the common header.
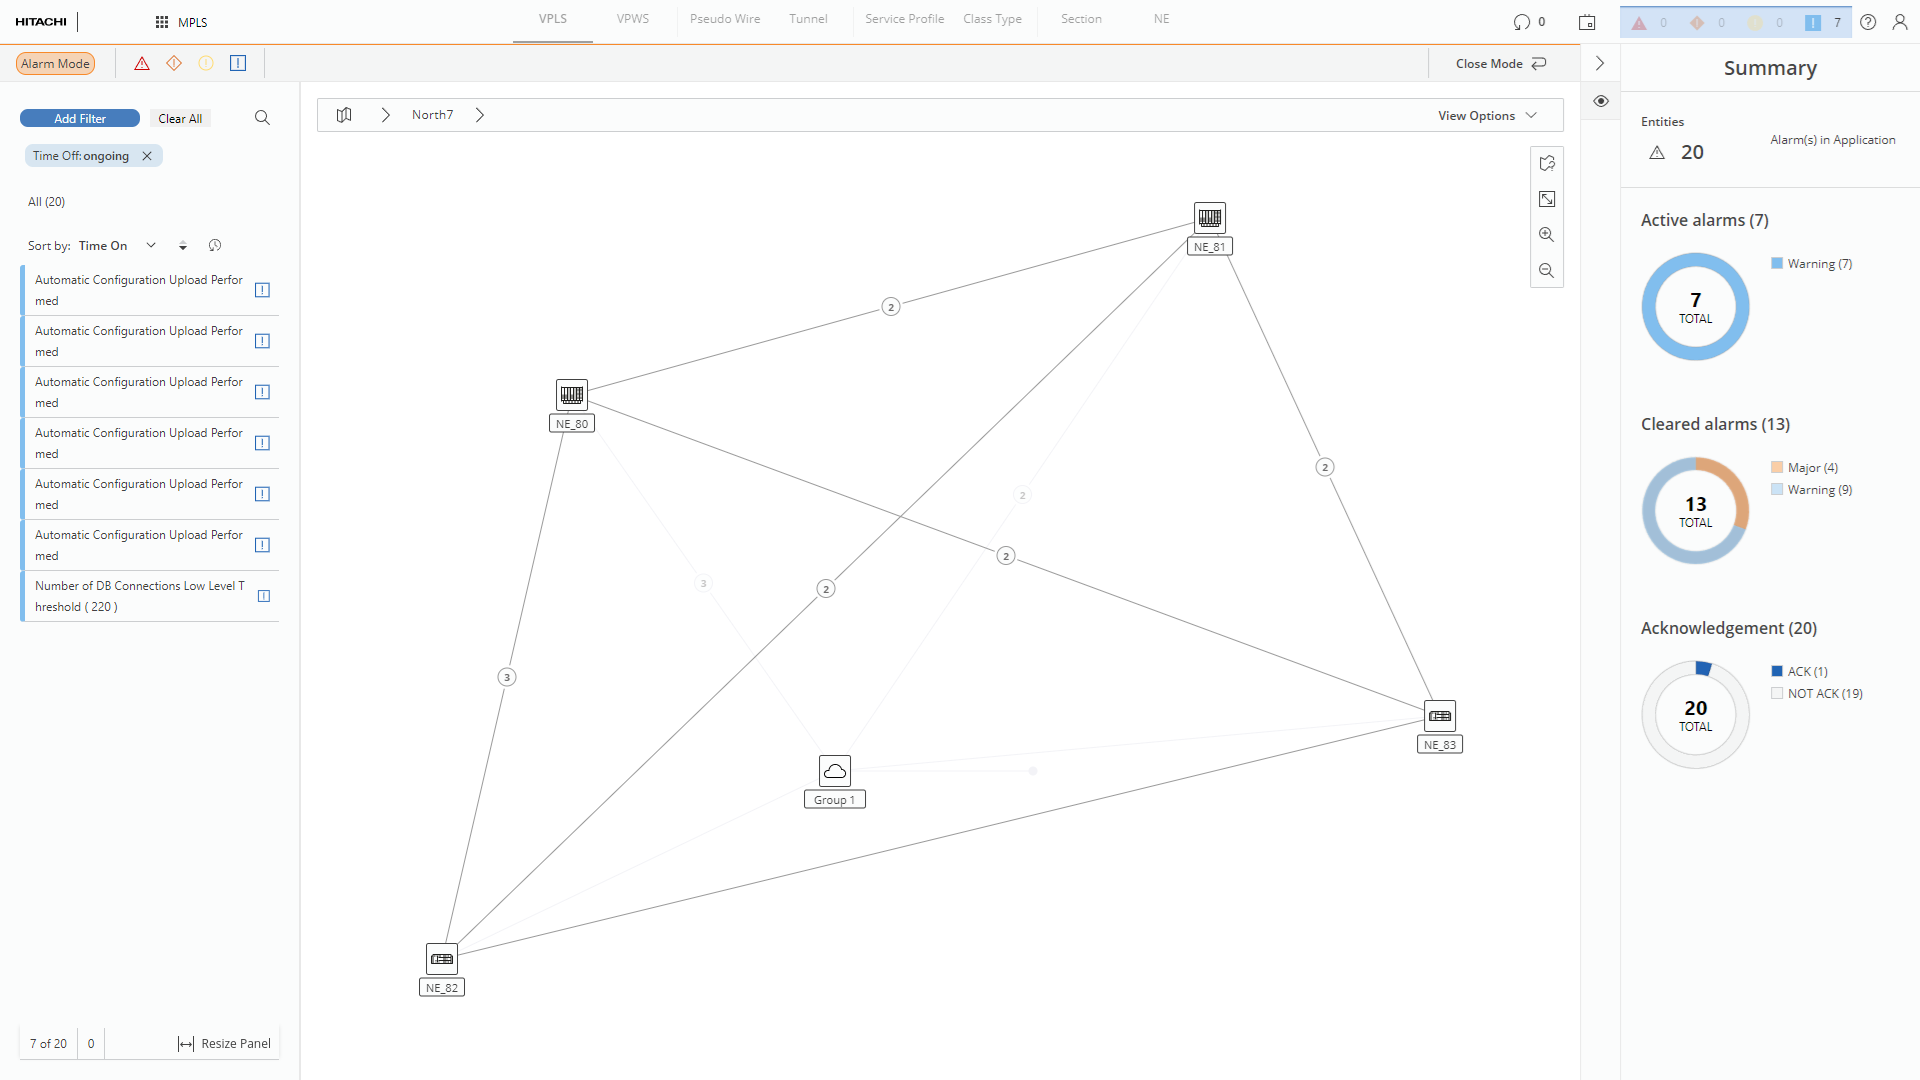
Alarm Mode